Dashboard Overview
Dashboards are the central component in MoBro, allowing you to visualize your data effectively.
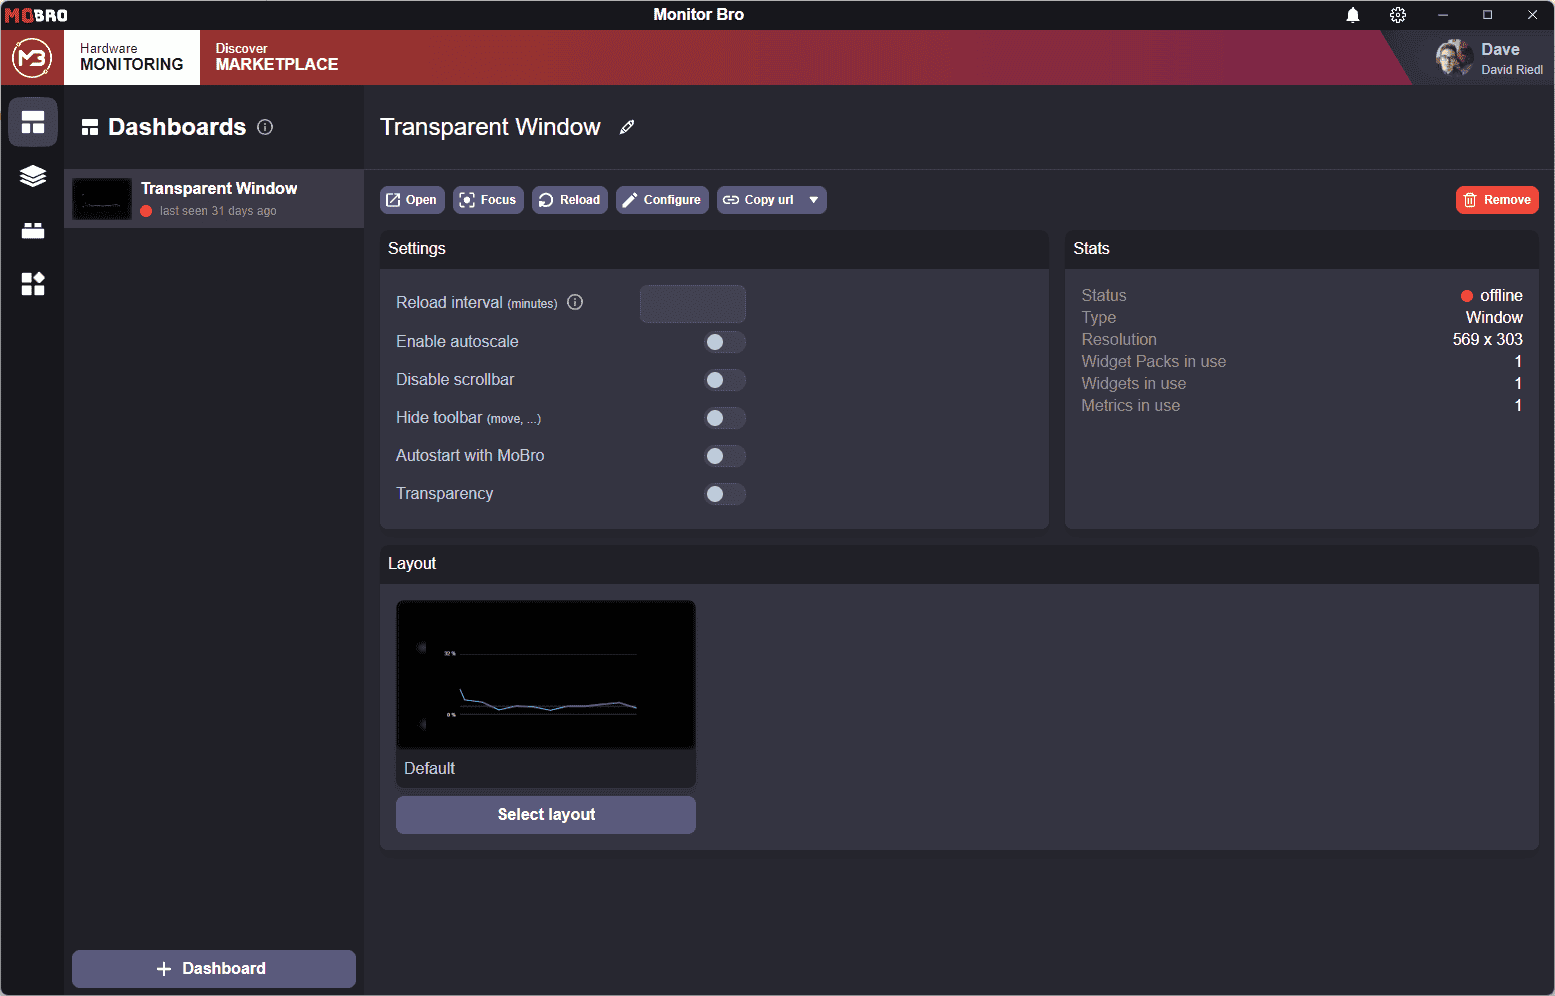
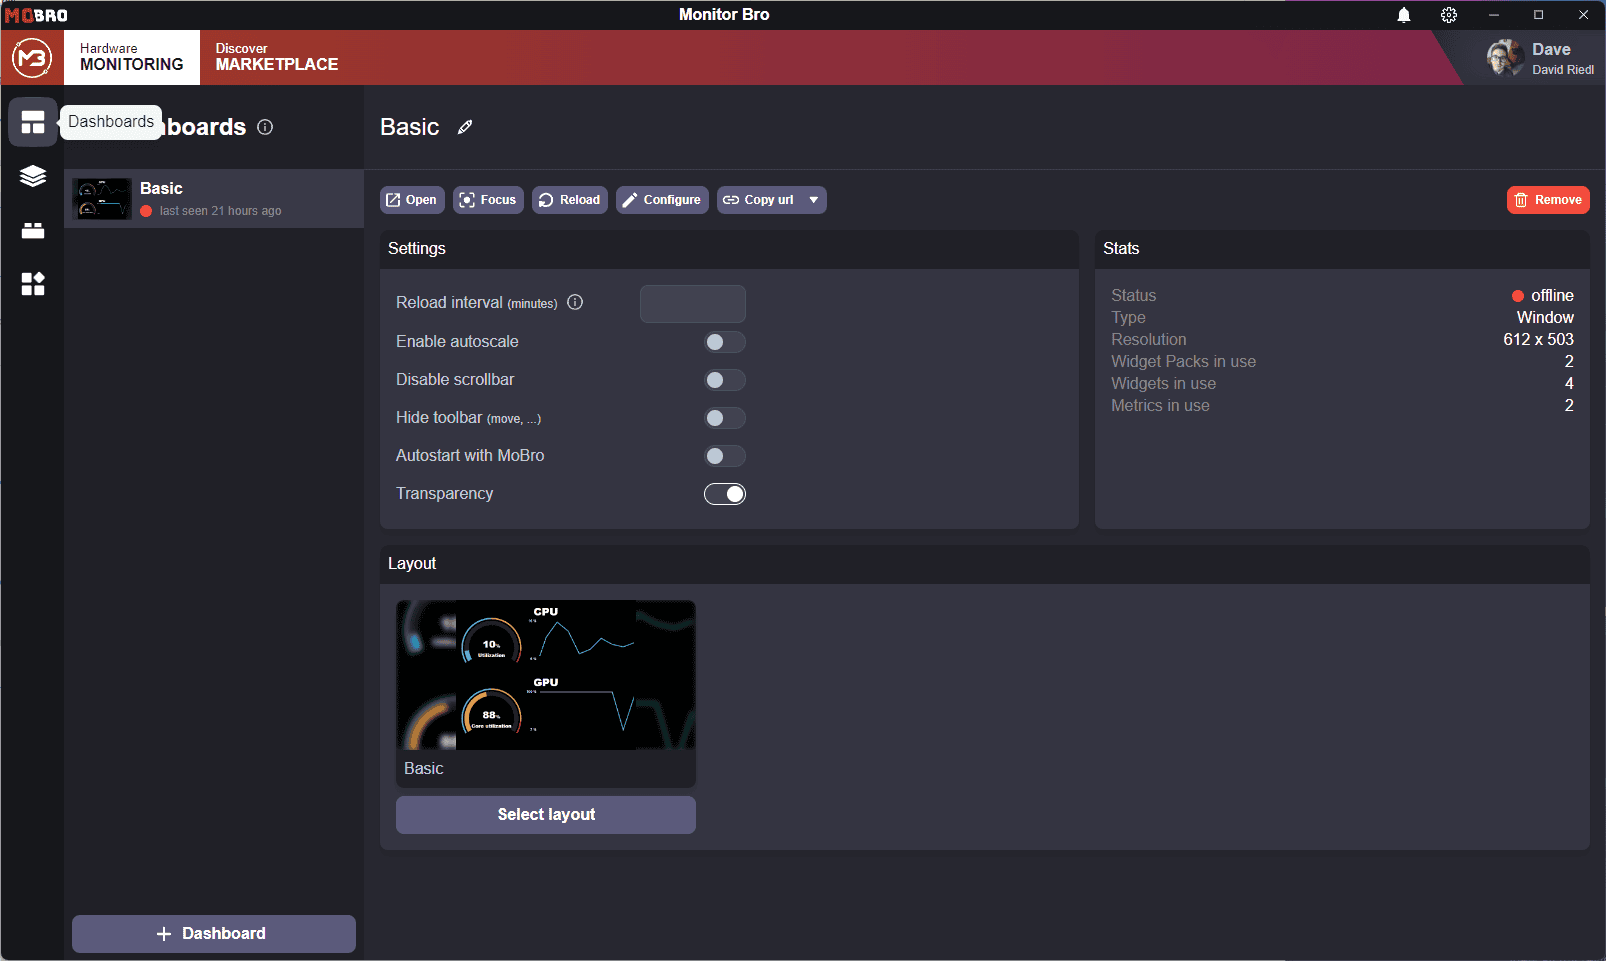
All your dashboards can be accessed under the Dashboards section found in the MONITORING tab.

Dashboard Types
While all dashboards fundamentally operate in the same way, they can be categorized into two main types:
Local Dashboards
Local dashboards are displayed on the same PC where the MoBro application is running.
These dashboards appear as a standard program window, which you can position freely anywhere on your desktop.
External Dashboards
As the name implies, external dashboards operate on a separate device connected to the same network as the PC running
MoBro.
Commonly, external dashboards are configured on devices such as:
However, nearly any device can act as an external dashboard as long as it:
- Is connected to the same network as the PC running MoBro
- Has an up-to-date browser installed
Dashboard Details
Clicking on a dashboard reveals its details panel on the right.
In this panel, you can:
- Adjust specific settings for the selected dashboard
- Monitor statistics
- Change the active layout
